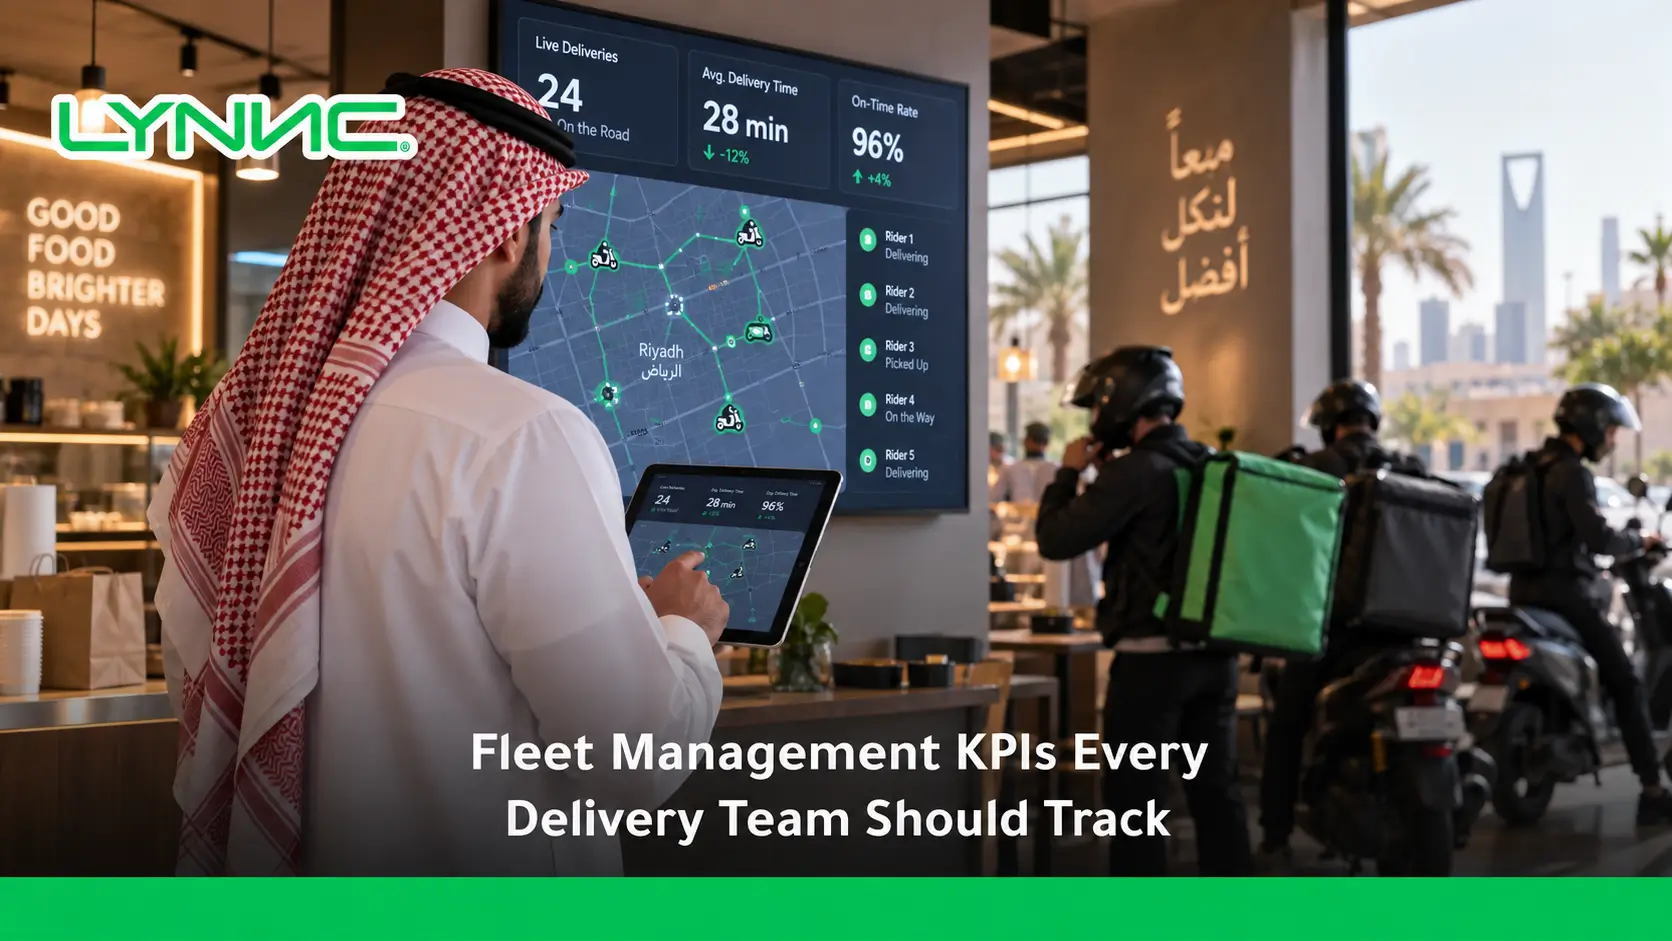
Fleet management KPIs for restaurant delivery help teams understand whether vehicles, drivers, routes, and delivery costs are supporting fast, reliable service. The right metrics reveal delays, wasted fuel, idle time, failed deliveries, driver productivity, and maintenance risks before they damage margins or customer experience. By combining driver-level measures, fleet-wide performance, telematics data, and structured review cycles, restaurants can make better decisions about routing, staffing, vehicle use, maintenance, and fleet investment.
Why Fleet Management KPIs Matter
- Lower Operating Costs: Tracking fleet management KPIs for restaurant delivery exposes unnecessary fuel use, excessive idling, inefficient routes, and other sources of avoidable delivery spending.
- Prevent Vehicle Downtime: Maintenance and fault data help teams identify problems earlier, schedule preventive work, and reduce unexpected breakdowns during delivery hours.
- Improve Driver Safety: Speeding, harsh braking, rapid acceleration, and similar behaviors can reveal where driver coaching or closer supervision may be needed.
- Protect Delivery Performance: On-time delivery and route data show whether the fleet can move prepared orders to customers without unnecessary delays.
- Support Customer Experience: More predictable deliveries help protect food condition, arrival expectations, and the overall experience associated with each order.
- Strengthen Fleet Decisions: Performance data gives managers better evidence when evaluating staffing levels, vehicle replacement, routing changes, or fleet expansion.
- Support Compliance: Driver activity, vehicle condition, and operating records can help teams monitor relevant safety and operational requirements.
Core Restaurant Delivery Fleet KPIs
Restaurant delivery fleets need metrics that connect service speed with operational cost and driver productivity. The most useful KPIs show where time, money, or fleet capacity is being lost.
The core measures are:
1. Average Delivery Time
Average delivery time measures how long it takes an order to move from dispatch or kitchen readiness to the customer's delivery point.
- Customer Impact: Within fleet management KPIs for restaurant delivery, this metric helps show whether delivery speed is supporting food quality and customer expectations.
- Delay Detection: Rising averages can reveal route problems, slow dispatch, traffic exposure, or poor coordination between kitchens and drivers.
- Trend Analysis: Comparing times by branch, shift, delivery zone, or daypart helps identify where delays repeatedly occur.

2. Cost per Delivery
Cost per delivery estimates how much the business spends to complete each successful delivery.
- Cost Components: Driver wages, fuel, maintenance, vehicle-related costs, and delivery technology can all contribute to the calculation.
- Margin Visibility: A rising cost per completed order may indicate poor route density, excessive mileage, idle time, or inefficient vehicle use.
- System Context: Connecting fleet expenses with order activity through (restaurant system software can give managers a clearer view of delivery economics.
3. Orders per Driver
Orders per driver measures how much completed delivery work each driver handles during a defined shift or period.
- Productivity View: Higher output can indicate better utilization when service quality and safe driving remain stable.
- Peak-Hour Planning: Fleet management KPIs for restaurant delivery can show whether lunch and dinner demand require different driver coverage.
- Workload Balance: Comparing driver output helps identify overloaded drivers, underused capacity, or uneven dispatch allocation.
4. Failed Delivery Rate
Failed delivery rate measures the share of dispatched orders that do not reach customers successfully.
- Failure Causes: Incorrect addresses, customer unavailability, severe delays, dispatch errors, or communication problems can all contribute.
- Financial Impact: A failed restaurant delivery can waste prepared food, driver time, vehicle capacity, and fuel within the same order.
- Root-Cause Analysis: Tracking the reason behind each failure helps teams separate customer-related issues from internal operational problems.
5. Driver Idle Time
Driver idle time measures periods when paid delivery capacity is available but not completing productive movement or deliveries.
- Kitchen Waiting: Long waiting periods can reveal poor synchronization between meal preparation and driver dispatch.
- Dispatch Gaps: Excessive idle time may indicate that drivers are poorly positioned or scheduled against actual demand.
- Capacity Use: For fleet management KPIs for restaurant delivery, lower avoidable idle time means more productive use of paid driver hours and available vehicles.
6. Fuel Consumption
Fuel consumption tracks how efficiently fleet vehicles use fuel relative to distance and delivery activity.
- Waste Detection: Excessive idling, unnecessary mileage, aggressive driving, or poor vehicle condition can increase consumption.
- Route Efficiency: Comparing fuel use with distance and completed orders helps reveal whether route planning is reducing unnecessary travel.
- Cost Control: Fuel is a recurring fleet expense, so even small efficiency problems can accumulate across frequent restaurant deliveries.
Driver Performance Metrics vs Fleet-Level Metrics
Component
Driver Performance Metrics
Fleet-Level Metrics
Focus
Individual driver behavior, safety, and productivity.
Overall fleet efficiency, capacity, cost, and asset performance.
Main Purpose
Improve individual performance and identify coaching needs.
Improve operating strategy and fleet-wide resource allocation.
Decision Horizon
Immediate or short-term actions.
Tactical and longer-term management decisions.
Typical Metrics
Orders per driver, personal idle time, driving behavior, stop time.
Cost per delivery, fleet utilization, fuel efficiency, maintenance cost.
Typical Action
Coaching, reassignment, or dispatch adjustment.
Vehicle replacement, capacity planning, routing changes, or technology investment.
1. Driver Performance Metrics
Driver-level measures isolate the human and behavioral factors affecting delivery performance.
- Safe Driving: Speeding, harsh braking, rapid acceleration, and sharp cornering can help identify drivers who may need coaching.
- Individual Productivity: Orders completed per shift show how effectively each driver converts available working time into successful deliveries.
- Stop Efficiency: Time spent at pickup or delivery locations can reveal avoidable delays within individual routes.
- Operational Diagnosis: Comparing fleet management KPIs for restaurant delivery at driver level helps determine whether a recurring issue is linked to one operator rather than the entire operation.
2. Fleet-Level Metrics
Fleet-level measures combine activity across drivers and vehicles to show whether the overall delivery operation is working efficiently.
- Fleet Utilization: The proportion of available vehicles actively supporting deliveries shows whether assets are being used effectively.
- Total Delivery Economics: Fleet-wide costs combine fuel, maintenance, labor, insurance, and vehicle expenses to provide a broader financial view.
- Route Efficiency: Aggregate mileage and delivery volumes show whether route planning is reducing unnecessary travel across the operation.
- Structural Diagnosis: If delivery times rise across nearly every driver, the problem may come from routing, kitchen readiness, capacity, or fleet design rather than individual performance.
How Telematics Improves Fleet Measurement
Telematics combines vehicle data with communication and location technologies to replace manual fleet reporting with more continuous operational visibility. It helps managers measure what vehicles and drivers are actually doing during delivery operations.
Its value appears in four main areas:
1. Measure Fleet Activity in Real Time
Location and vehicle data can show what is happening during active delivery operations rather than only after a shift ends.
- Route Visibility: GPS information allows fleet management KPIs for restaurant delivery to reflect actual routes, distances, and vehicle movement.
- ETA Monitoring: Current location and route progress can improve estimates of when drivers are likely to reach customers.
- Idle Detection: Extended engine or vehicle idle periods can be identified without relying only on driver reports.
- Operational Response: Managers can react to delays or route deviations while deliveries are still in progress.
2. Measure Driving Behavior Objectively
Vehicle and motion data can replace subjective assumptions about how drivers behave on the road.
- Harsh Braking: Repeated sudden braking can indicate risky driving or route conditions that deserve investigation.
- Rapid Acceleration: Aggressive acceleration may affect fuel efficiency, vehicle wear, and driver risk profiles.
- Speed Monitoring: Comparing driving speeds with operating policies can support safer fleet management.
- Driver Scorecards: Combined behavior measures can create a consistent basis for coaching and performance reviews.
3. Improve Maintenance Measurement
Telematics can connect vehicle usage with maintenance needs instead of relying only on fixed calendar dates.
- Mileage Tracking: Actual distance traveled helps determine when usage-based maintenance should be reviewed.
- Engine Hours: Operating time can provide additional context for vehicles exposed to heavy stop-and-go delivery work.
- Fault Signals: Where supported by vehicle hardware, diagnostic information can alert teams to emerging mechanical issues.
- Preventive Maintenance: Earlier visibility can reduce the risk of preventable breakdowns interrupting delivery operations.
4. Connect Vehicle Activity With Cost
Operational data becomes more useful when managers can relate vehicle behavior to financial performance.
- Fuel Efficiency: Distance, idling, and consumption data help explain why certain vehicles or routes use more fuel.
- Waste Identification: Unnecessary mileage or repeated idle periods can expose costs that would otherwise disappear inside total fuel spending.
- Vehicle Comparison: Fleet management KPIs for restaurant delivery can reveal whether certain assets consistently cost more to operate than comparable vehicles.
- Replacement Decisions: Cost, maintenance, and utilization trends together provide stronger evidence for deciding when an asset is no longer economical.
How Often Fleet KPIs Should Be Reviewed
Review frequency should match how quickly a metric can affect operations. Immediate service measures need frequent attention, while asset and investment decisions require longer periods of data.
A practical review cycle includes:
1. Real-Time and Daily Review
These reviews focus on problems that can affect today's deliveries.
- Metrics to Watch: Fleet management KPIs for restaurant delivery such as delivery time, driver idle time, route progress, and failed deliveries belong in this review cycle.
- Operational Goal: Teams can redirect drivers, investigate delays, or respond to delivery failures before the same issue affects more orders.
- Best Use: Daily monitoring is most useful for measures that directly influence current service performance.
2. Weekly Review
Weekly reviews focus on short-term patterns that may not be visible from one shift.
- Metrics to Watch: Orders per driver, fuel consumption, driving behavior, idle-time trends, and safety events.
- Performance Goal: Managers can identify recurring productivity gaps and drivers who may need coaching or recognition.
- Trend Detection: A weekly view reduces the risk of reacting too strongly to one unusual day.
3. Monthly Review
Monthly reviews are better suited to financial efficiency and vehicle condition.
- Metrics to Watch: Cost per delivery, fleet utilization, maintenance spending, fuel trends, and recurring vehicle downtime.
- Financial Goal: Managers can compare actual fleet spending with budgets and investigate persistent cost increases.
- Maintenance Planning: Monthly patterns can support preventive work before problems become operational disruptions.
4. Quarterly and Annual Review
Longer reviews support decisions that require enough data to identify structural patterns.
- Metrics to Watch: Fleet ROI, long-term maintenance trends, vehicle lifecycle performance, utilization, and asset replacement needs.
- Strategic Goal: Fleet management KPIs for restaurant delivery can support decisions about fleet expansion, vehicle replacement, technology investment, or major process changes.
- Planning Value: Longer review periods prevent large capital decisions from being based on short-term fluctuations.
How LYNNC Centralizes Fleet Performance Data
LYNNC connects restaurant order and delivery operations so teams can follow delivery activity within a more unified environment. Its current fleet capabilities include real-time tracking and route-focused delivery management alongside centralized order visibility.
The operational value can be viewed in three areas:
1. Connect Orders With Delivery Execution
Centralized visibility helps teams follow the transition from restaurant order activity into last-mile delivery.
- Connected Workflow: Fleet management KPIs for restaurant delivery become easier to interpret when order status and delivery activity are not managed as completely separate processes.
- Order Context: Managers can relate delivery delays or failures to the order and branch involved instead of reviewing fleet activity in isolation.
- Central Visibility: LYNNC provides centralized order management while its fleet offering focuses on drivers, routes, and last-mile delivery activity.
- Operational Coordination: A connected view can reduce the need to reconcile multiple disconnected sources before investigating delivery issues.
2. Track Delivery Activity in Real Time
Current fleet visibility helps operations teams understand what is happening during delivery execution.
- Vehicle Location: Live tracking provides visibility into the current movement of delivery vehicles.
- Route Monitoring: Route information can help teams identify delays and inefficient delivery movement.
- Delivery Timing: ETA visibility supports closer monitoring of expected delivery performance.
- Fleet Context: A delivery fleet managementgives restaurant teams a structured way to connect vehicle movement with last-mile operations.
3. Build a More Consistent Performance View
Centralized operating data becomes more useful when managers can compare delivery activity across orders, drivers, and branches.
- Performance Comparison: Repeated delivery records can help managers compare delays, failed deliveries, and operational differences across locations.
- Exception Visibility: Unusual delivery activity becomes easier to identify when teams work from a connected operational environment.
- Better Diagnosis: Managers can separate driver-related problems from wider issues involving dispatch, routes, branch operations, or capacity.
- Decision Support: Combining operational context with fleet management KPIs for restaurant delivery gives teams a stronger basis for adjusting routing, staffing, and delivery processes.
related guide: Delivery Management for Restaurant Fleets: Link Orders and Prevent
Fleet Management KPIs for Restaurant Delivery FAQs
Which fleet management KPIs should restaurant delivery teams track first?
Restaurant delivery teams should start with average delivery time, cost per delivery, orders per driver, failed delivery rate, driver idle time, and fuel consumption. Together, these metrics cover service speed, productivity, cost, and fleet efficiency.
How is cost per delivery calculated?
Cost per delivery compares total delivery operating expenses with the number of successfully completed deliveries. Relevant costs can include driver wages, fuel, vehicle maintenance, insurance, and delivery technology.
What does a high driver idle time indicate?
High idle time can indicate poor coordination between kitchen preparation and driver dispatch, weak scheduling, or insufficient order volume. Tracking the cause helps managers separate unavoidable waiting from operational inefficiency.
Why is failed delivery rate important for restaurants?
A failed delivery can waste prepared food, fuel, driver time, and vehicle capacity at the same time. Monitoring failure reasons helps teams identify recurring problems involving addresses, customer availability, dispatch, or delivery delays.
How can telematics improve fleet management performance metrics?
Telematics can provide location, route, vehicle-use, and driving-behavior data. This allows managers to measure idle time, mileage, route efficiency, fuel use, safety events, and maintenance needs with greater operational visibility.
How often should fleet management KPIs for restaurant delivery be reviewed?
Operational metrics such as delivery time, failed deliveries, and idle time may need daily monitoring. Driver performance can be reviewed weekly, financial and maintenance metrics monthly, while fleet investment and replacement decisions benefit from quarterly or annual analysis.
What is the difference between driver-level and fleet-level KPIs?
Driver-level KPIs measure individual productivity, safety, and behavior, while fleet-level KPIs assess overall cost, utilization, fuel efficiency, maintenance, and capacity. Reviewing both helps managers determine whether a problem comes from one driver or the wider delivery operation.
How can a Fleet Management System support restaurant delivery operations?
A Fleet Management System can centralize information about drivers, vehicles, routes, and delivery activity. This makes it easier to monitor performance trends, identify operational exceptions, and use LYNNC restaurant technology platformwhen improving routing, staffing, and vehicle utilization